During August we saw supply start to stabilize and demand get a tiny bit weaker. Overall supply remains stuck some 32% below normal while demand is a tiny bit stronger than normal, with closed sales doing a little better than usual while pending and UCB listing counts are a little weaker. It remains a seller’s market overall. The Cromford® Market Index moved from around the 145 mark at the beginning of August to around the 148 mark at the beginning of September. This is not a big enough change for us to feel any significant difference in real life. The market balance moved just a bit in favor of sellers, but there is almost no momentum left in that trend.
Sales were up 9% from August last year, but not as much as they had been in July (16%). Good but not exceeding expectations.
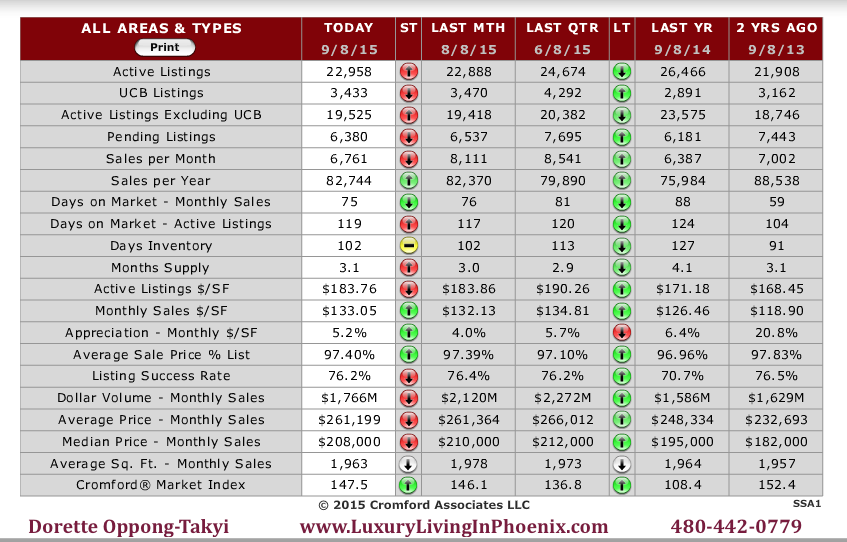
Here are the basic ARMLS numbers for September 1, 2015 relative to September 1, 2014 for all areas & types:
- Active Listings (excluding UCB): 19,101 versus 23,296 last year – down 18.0% – and down 1.8% from 19,459 last month
- Active Listings (including UCB): 22,413 versus 26,142 last year – down 14.3% – and down 1.9% compared with 22,837 last month
- Pending Listings: 6,259 versus 6,079 last year – up 5.2% – but down 1.1% from 6,327 last month
- Under Contract Listings (including Pending & UCB): 9,571 versus 8,797 last year – up 8.8% – but down 1.4% from 9,705 last month
- Monthly Sales: 7,056 versus 6,492 last year – up 8.7% – but down 11.6% from 7,978 last month
- Monthly Average Sales Price per Sq. Ft.: $132.54 versus $126.14 last year – up 5.1% – but down 0.3% from $132.88 last month
- Monthly Median Sales Price: $208,000 versus $198,000 last year – up 5.1% – but down 1.8% from $211,750 last month
Appreciation of around 5% seems to be the order of the day. This may not appear to be a big number but in a deflationary climate a 5% climb should be interpreted as rather impressive. It is mostly down to supply shortages at the low end, with a sprinkling of strong demand in a few luxury markets. We did see the usual seasonal price weakness from the end of June through the beginning of September, but that short term trend is gradually giving way to a resumption of the longer term upward trend. Indications are that sales prices will move moderately higher over the next 4 months. We expect rents to move higher more quickly.
There were few significant changes in the supply by price range with most ranges seeing less than 5% up or down compared with a month ago. The only exceptions were:
- $25K-$50K +11%
- $75K-$100K -12%
- $100K-$125K -16%
- $1.5M-$2MK -6%
Over the past month, most news items were focused on violent gyrations in the stock market with the real estate market settling down into a nice, normal and predictable pattern. There was some concern expressed that stock market volatility could affect the housing market, though there has been little evidence of any correlation between the two over the past 50 years. The only exception was in 2007 through 2008 when the housing market collapsed following the excessive money supply between 2003 and 2006. This brought the stock market to its knees. It does not tend to happen the other way round, especially when there is a chronic shortage of housing.
We note that there is still a huge over-supply of unoccupied housing and commercial buildings in China and the comments above apply only to Greater Phoenix. I guess we should not be surprised if a Communist Party makes a few basic mistakes when trying to run a capitalist system. In many Chinese cities there are over 30 months of supply while we have about 3.
It is good for Phoenix that Arizona’s economy is not dependent on the commodity and raw materials business. Our copper mines are in bad financial shape with copper prices sinking ever lower due to weak demand from Asia. However, many of the biggest mines are owned by Mexican corporations these days. The oil and gas business is likely to have some difficult months, if not years, ahead, but Phoenix’s housing market is not driven by the energy sector, either. A deflationary cycle will make our homes look more expensive to foreigners, but our real estate market depends very little on demand from foreign countries. Canada has supplied most of the foreign home buyers in the past few years but in the last 3 months only 163 Maricopa County homes were purchased by Canadians. That compares with 1,498 in the peak of 2011. This huge percentage drop has not caused us any serious problems, even though the Canadian demand is not likely to come back any time soon.
All in all, our local housing market looks like it is in strong shape to take everything the world economy can throw at it.
Phoenix Real Estate Market Snapshot September 8, 2015
—Courtesy of The Cromford Report.
[wnt_grid keyid=”1″ title=”Just listed for sale homes” maptype=”disabled” ownertype=”all” paginated=”false” sortoptions=”false” maxresults=”20″ search_mode=”form” primarysearchtype=”active” searchtype=”zip” state=”AZ” min_price=”0″ max_price=”1000000000″ listing_status=”Active” newListings=”1″ single_family_detached=”y” /]