Demand for homes for sale priced between $200,000 and $600,000 was stronger making it a sellers market while homes priced $600,000 and above seemed to be in a balanced market.
Supply for homes for sale priced $2,000,000 and above seem to be not be affected compared to last year.
Market Summary for the Beginning of March
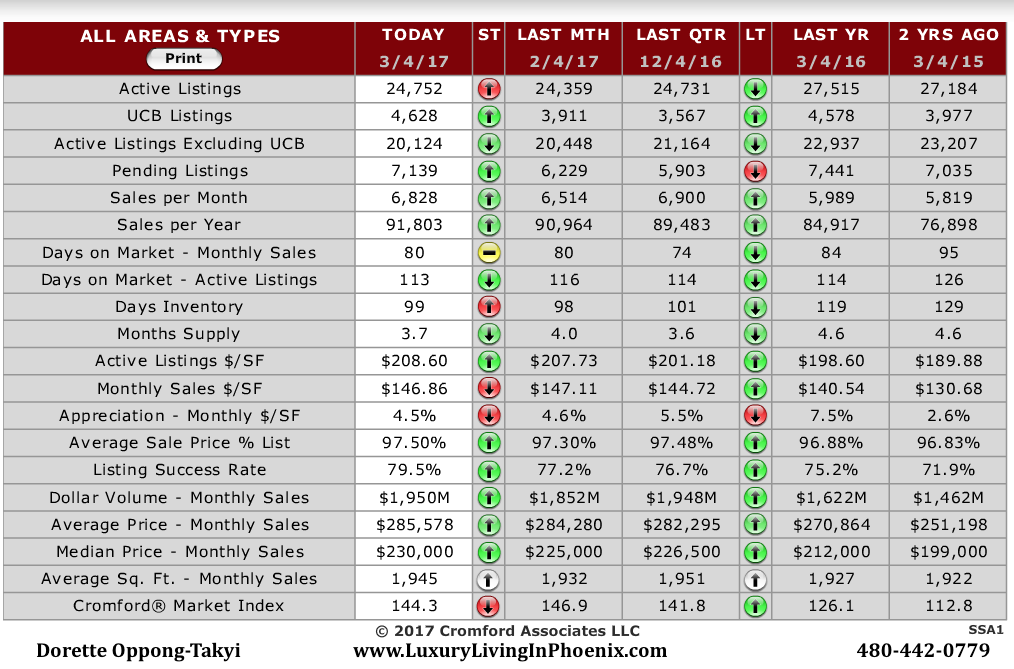
Let us start with the basic ARMLS numbers for March 1, 2017 and compared with March 1, 2016 for all areas & types:
- Active Listings (excluding UCB): 19,648 versus 22,587 last year – down 13.0% – and down 1.1% from 19,863 last month
- Active Listings (including UCB): 24,269 versus 27,146 last year – down 10.6% – but up 2.7% compared with 23,632 last month
- Pending Listings: 7,194 versus 7,214 last year – down 0.3% – but up 18.0% from 6,095 last month
- Under Contract Listings (including Pending, CCBS & UCB): 11,815 versus 11,773 last year – up 0.4% – and up 19.8% from 9,864 last month
- Monthly Sales: 6,517 versus 5,805 last year – up 12.3% – and up 8.0% from 6,037 last month
- Monthly Average Sales Price per Sq. Ft.: $147.69 versus $140.88 last year – up 4.8% – and up 0.5% from $146.88 last month
- Monthly Median Sales Price: $230,000 versus $213,000 last year – up 8.0% – and up 2.2% from $225,000 last month
Taking a closer look at supply, we can see that total active listings increased slightly over the last month. However, an increasing percentage of these are under contract accepting backups (or claim to be), and if we look only at actives without a contract this number declined from last month. A decline between February 1 and March 1 is usually a clear signal of weak supply, and so it is in 2017, although the supply is much weaker at some price points than others. Active listing counts fell for the price ranges between $50K and $200K, but rose in every other price range. The greatest percentage rise in active listings over the last month was for $800K to $1M which saw an increase of 10%.
Turning to demand we see a healthy increase in closed sales, up more than 12% compared with a year ago. However the comparisons of pending listings and under contract listings are not as impressive, down 0.3% and up 0.4% respectively. Slightly mixed signals here, but certainly not bad news.
As you would expect with weakening supply and strengthening demand, prices continue to rise. The monthly median has finally broken above $225,000 again and reclaimed the $230,000 mark we last saw in October. The more dependable average price per sq. ft. number continues to inch higher with overall appreciation close to 5%.
Under $200K, total supply has fallen another 20% since last year, when it was already tight, so buyers looking for homes in this price range are going find it tough going, as they have for a long time now.
Between $200K and $2M, supply is down about 10% compared with this time last year. However demand has grown much more strongly for the $200K to $600K range than above $600K, so the balance in the market favors sellers under $600K but is more balanced above $600K.
Over $2M, we have roughly the same supply as last year, which is to say, far more than adequate. In most areas it is a buyer’s market in this top end with the sales rate a little weaker than a year ago. There is little upward pressure on overall prices, but individual properties will still sell for extremely high numbers if they are desirable enough. this makes our price readings very volatile from month to month.
— The Cromford Report

